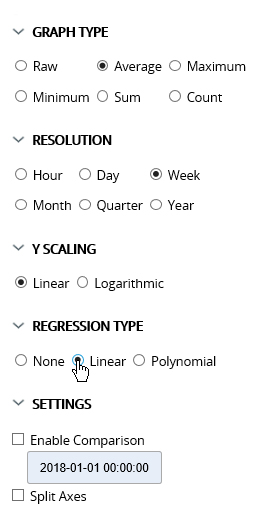
None is the default option, but you can select Linear or
Polynomial. For the Regression to be visible in your chart, choose Linear for a
straight line or Polynomial to see curves.
Select one of these options and click REFRESH to display an
appropriate regression line on the chart.